
Brief: Create an interactive activity tracker that shows the correlation between individual students and the twelve activities that were measured over a twenty-four hour time period.
Concept: The data for this design varied greatly, as all students spend their time differently. As such, I made sure that the size proportions between the maximum and minimum times were very noticeable so they immediately stood out and grabbed the viewers attention.
Programs and Language Used:
Illustrator, SVG, D3.js.
Illustrator, SVG, D3.js.
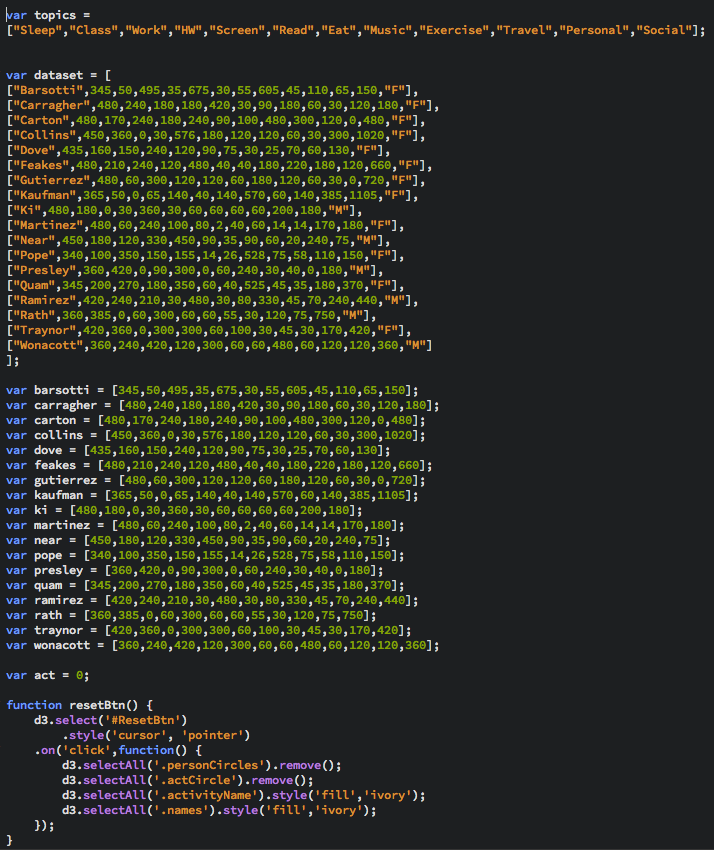
Behavior file showing my initial dataset that I will pull from.

Snippet of behavior file showing how the activity headers are drawn.
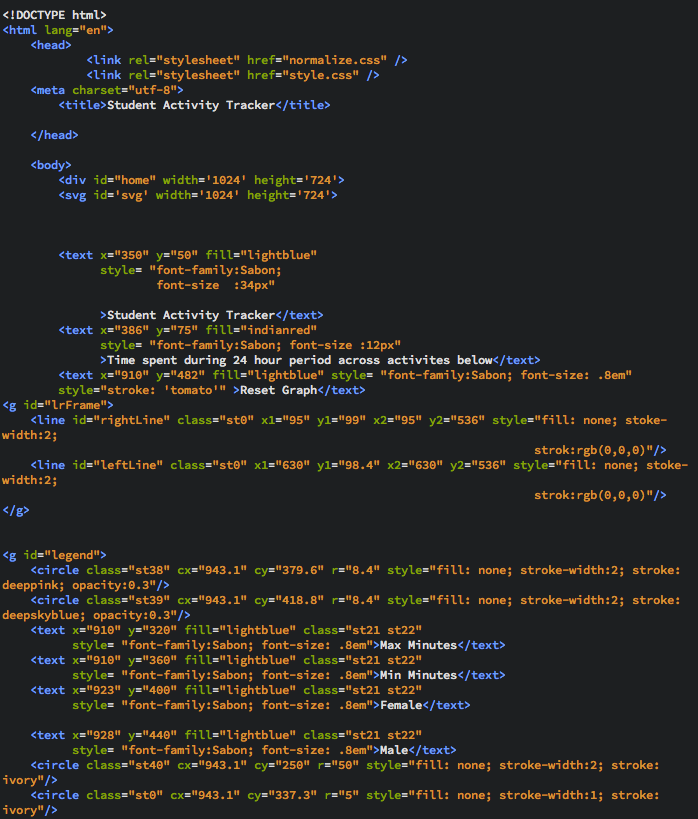
HTML snippet showing placement of SVG element.

CSS